SOCIAL SCIENCES | November 3, 2023
UIUC Professor Greg Howard Analyzes the Impact of Remote Work on the Housing Market
Jeremy Septon

Remote work has become highly popularized since the COVID-19 pandemic. Credit: Vlada Karpovich
In March 2023, the Pew Research Center conducted a poll which found that 35% of US adults that have jobs that can be worked remotely do so full time, with another 41% opting to work remotely at least some of the time. Compared to the 7% of US adults that worked remotely full-time before the COVID-19 pandemic, this is a significant change.
Remote work offers various freedoms to workers. The same 2023 poll found that a majority of remote workers support remote work since it allows them to balance their work and personal life better. They also believe that it helps with their ability to meet deadlines. On top of that, full-time remote work enables workers to live virtually anywhere in the world. For hybrid workers, the requirement of working in-person part-time allows similar flexibility: they may move further out of the city, only needing to put up with a long commute select days a week.
With the freedoms of remote work changing the nature of the word ‘commute’ for many Americans, some have begun to reconsider their priorities. Opting to trade the density and cost of the city for the space and greater affordability of suburbs and exurbs, remote work has fundamentally shifted where people live.
University of Illinois Urbana-Champaign Professor Greg Howard, has co-authored a recent paper that analyzes the impacts of remote work on housing costs and population movements. Studying both the short-run and long-run time horizons, Howard and his co-authors have built a rigorous model that gives insight into how changes in what people look for in a home and hometown affects rent and housing prices across the country. The paper discusses that while remote work has increased rents in the short-run, over time, rents are expected to decline, potentially below pre-pandemic levels.

Dr. Greg Howard, Assistant Prof. of Economics
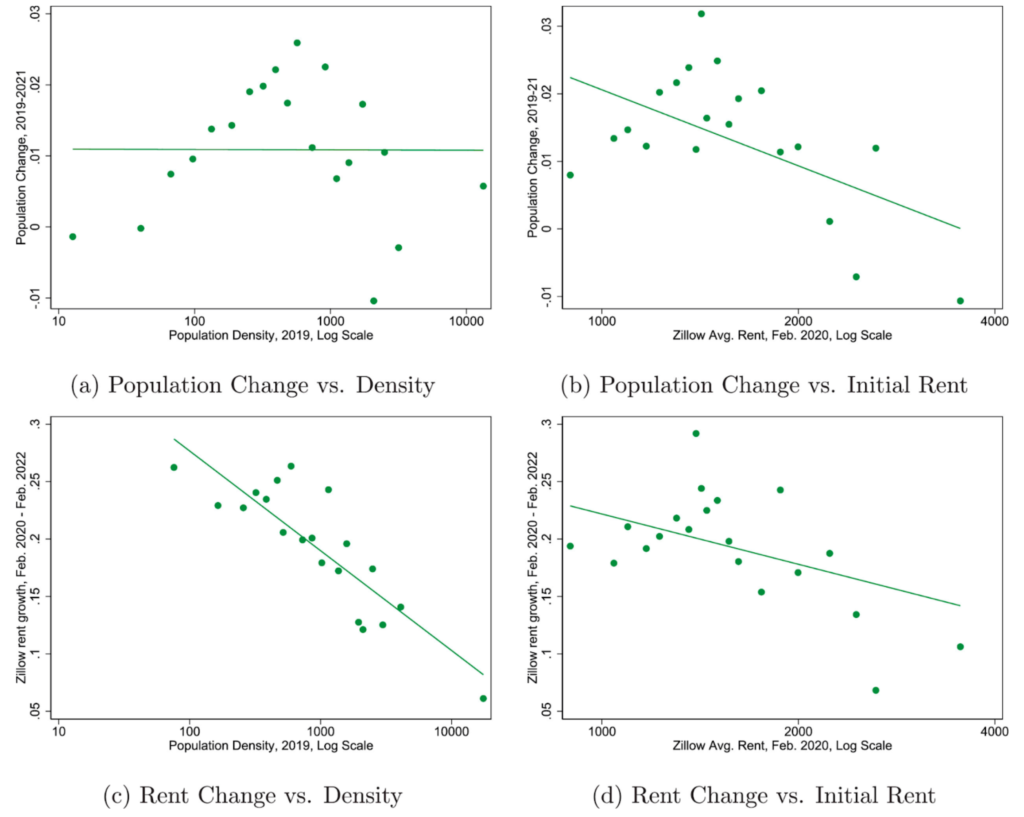
This figure shows binned scatter plots. Panels show the relationship between rent/population changes and population density (Panels A and B) and between rent/population changes and ex ante prices (Panels C and D). Plot created with 20 bins, which are weighted by 2019 county population. Credit: Howard, G., Liebersohn, J., & Ozimek, A. (2023). The short- and long-run effects of remote work on U.S. Housing Markets. https://doi.org/10.1016/j.jfineco.2023.103705
The above graphs illustrate trends key to motivating the authors’ work. The trends show that the population moved from most dense cities, to areas of more moderate and lower densities. They also show that rent grew the most in those comparatively less-populous areas. These broad trends show a clear relationship between housing costs and population movements, which Professor Howard looks to illuminate.
To build their model, the researchers looked at two fundamental questions: How has remote work changed where people want to live (location demand)? And how has remote work changed the demand for larger homes (housing demand)?
The study examines the interaction between these two effects and three time horizons: pre-pandemic, the short-run (immediate future), and the long-run (a term used by economists to show where things will gravitate towards over time).
The first time horizon, pre-pandemic, is where everyone essentially “picks” a location by living there. In the short-run, housing supply is inelastic, meaning that there isn’t time to just build more homes in response to more demand, and some people move. In the long-run, everyone who wants to move is able, and housing supply returns to its pre-pandemic elasticity levels.
To build the mathematical part of the model, the following four key parameters were constructed:
- µ : location demand elasticity. This describes how sensitive people are to rents in a given location. The larger gets, the less the cost of rent matters to people in a particular location.
- λ : housing demand elasticity. This depicts how much the size of a home people want changes relative to housing costs. measures how much a 1% increase in rent decreases the size of a home people demand.
- Φ : mobile share of households. This expresses the portion households that want a different size home are able to move in the short-run.
- σi : local housing supply elasticity. This represents the long-run housing supply elasticity for each individual county. This parameter establishes how much a given county can/will expand their housing supply over a 10-year period.
To distinguish the effects from other factors like monetary policy, the authors look primarily at rents as a proxy for overall housing costs. They note that housing prices and rents are relatively correlated. Since monetary policy (such as the interest rate) has a much bigger impact on home purchasing as compared to renting, looking at rents gives the trends without interference from monetary policy.
Through the model, the authors find that the short-run effects of remote work on affordability are greater than the long-run ones. In the short-run, people are moving out of cities and towards higher-amenity and more spacious places. In the long-run, these effects are less pronounced and may move in a different direction.
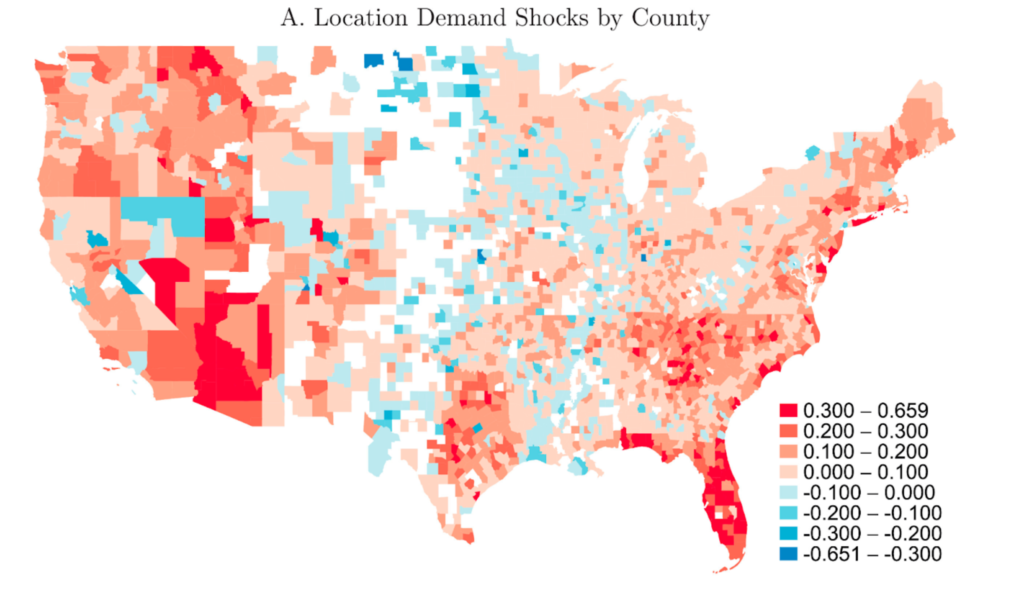
This figure shows location demand shocks and location demand projected onto remote work shocks. Panel A is a choropleth map showing the location demand at the county level. Credit: Howard, G., Liebersohn, J., & Ozimek, A. (2023). The short- and long-run effects of remote work on U.S. Housing Markets. https://doi.org/10.1016/j.jfineco.2023.103705
The above graphic was constructed by the authors to visualize the short-run trends noted above. The shades of red indicate areas with positive location demand shock, or areas where people are moving to. The shades of blue indicate areas with negative location demand shock, or areas where people are moving from.
Looking closely, this graphic illuminates the “donut effect,” wherein people are moving out of cities into nearby regions. Take New York City as an example of this. New York City (on the Southern tip of New York) is a blue spot, indicating that people are leaving the city. Looking around New York City, the surrounding counties are all red, indicating net positive population migration in these regions. Across the country this trend appears, including in other populous regions like San Francisco/Silicon Valley.
Returning to the two fundamental questions regarding location demand and housing demand, the authors find that over time, prices will fall in larger cities, potentially even below pre-pandemic levels. In terms of housing demand, since housing supply will eventually meet the demand in the long-run, the long-run price effect of changes in housing demand is only one fourth of the short-run effect. Put together, the impact of remote work on housing costs is far below the current levels that we are seeing.
While remote work may have declined from its peak-level at the height of the COVID-19 pandemic, remote work is still ubiquitous and its effects are still real. However, even with workers returning to the office, Professor Howard stated that this model is valid. The effects may be slightly scaled down with workers returning, but the direction and general effect modeled in the paper are still very much in-tact. With remote work here to stay and some of the dust from the height of the pandemic settling, the authors’ work is more significant now than ever before.
Our gratitude to Professor Howard for graciously giving his time. The full paper can be found in the October 2023 edition of Journal of Financial Economics or online here.
References
___________________________________________________________________________________________________________
- Howard, G., Liebersohn, J., & Ozimek, A. (2023). The short- and long-run effects of remote work on U.S. Housing Markets. Journal of Financial Economics, 150(1), 166–184. https://doi.org/10.1016/j.jfineco.2023.103705
- Parker, K. (2023, March 30). About a third of U.S. workers who can work from home now do so all the time. Pew Research Center. https://www.pewresearch.org/short-reads/2023/03/30/about-a-third-of-us-workers-who-can-work-from-home-do-so-all-the-time/
About the author
Jeremy Septon is a sophomore studying Economics and Statistics at the University of Illinois Urbana-Champaign. He is deeply interested in the social sciences and how their insights can transform the world. In his free-time, he is an avid reader, baker, and podcast enthusiast.